|
The Second System: The No-Friday System We used the 1 hour charts to test this system. Here are the details:
1. No trades were taken on NFP Friday;
2. Trade entered after a close above/below the high of NFP Friday, meaning if on a day after Friday, the currency pair broke above the high or below the low from Friday, then we bought or sold;
3. Stops were still 100 pips on the other side of the box;
4. One reversal trade per month was taken, and according to the same rules – when the stop was hit, we reversed;
5. Reversal stop loss was placed 100 pips beyond the opposite side of the box.
6. We held onto the trades for the entire month to determine what the maximum profit on each trade would be.
At the www.robbooker.com/PowerNFP Web site, you’ll find a spreadsheet with the results of our testing on this second system.
If you are reading this eBook as part of a CD that you received at a seminar, Expo, then the spreadsheet is on the CD.
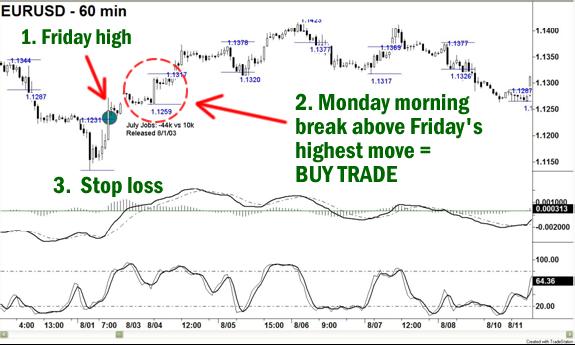
Example #1: Buy Trade on Second System
This is an example of a buy trade taken with the second system. You’ll notice that it has a really wide stop loss, but that’s the way we tested it.
This chart is from the August 01, 2003 Non Farm Payroll release.
In position #1, we see the highest point that the currency pair reached on Friday (approximately 1.1265). In position #2, we get a break higher than that level on Monday, and we buy the currency pair. We place a stop loss at position #3, 100 pips lower than the bottom of Friday’s box.
Figure 5. On Friday, the currency pair jumps up above the New York Box. But we don’t trade until Monday, when the currency pair jumps up even higher.
Example #2: Sell Trade on Second System
This is an example of a sell trade taken with the second system.
This chart is from the April, 04, 2003 Non Farm Payroll release.
In position #1, we mark Friday’s lowest point (approximately 1.0700).
In position #2, we see that on Sunday evening the currency pair broke even lower on a gap move – and this triggers an immediate sell at approximately 1.0685. The stop loss goes at position #3, at 100 pips higher than the top of Friday’s New York Box – at 1.0864.
The next section discusses a number of theories that I have about trading the Non Farm Payroll report in the longer term. You might want to use the charts provided in order to test some of these theories. You might want to think up some of your own ideas.
Figure 5. On Friday, the currency pair falls below the bottom of the New York Box, but we don’t trade. We do trade on Sunday when the currency pair falls below the lowest point reached on Friday.

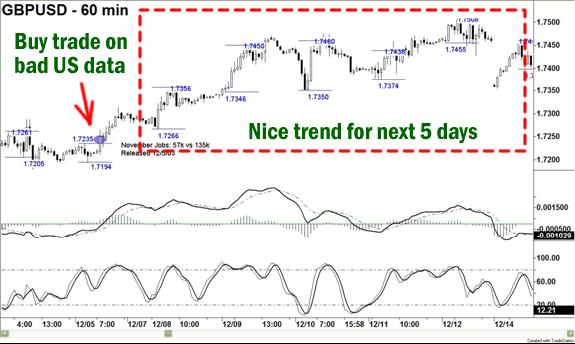
Untested System #1: Using the Expected vs. Actual Numbers
I believe there is a strong correlation between the length/strength of a post-NFP move and the relative shock that comes from getting an unexpected number. For instance, on December 5, 2003, the Non Farm Payroll number released was 57,000 jobs created, versus an expected number of 135,000. Here is what happened for the days afterward:
With this theory, a trader would only trade if the actual number released is between 75,000 and 100,000 jobs different than the expected number. The direction of the trade could be based on the actual number (if it is bad for the USD, then sell the USD automatically), or it could be based on a break of the New York Box.
Figure 6. A big surprise in the NFP number could be the catalyst for a big move for several days (even weeks) afterwards.
Untested System #2: Using Indicators
We’ve provided the MACD-Histogram (12, 26,9) and the Slow Stochastic (9,3,3) on each chart, so that we could later glance at two common indicators to see if they would help us plan or take trades.
You might consider:
1. Looking for Overbought/Oversold conditions before the report is released, or afterwards. Maybe you could look for a strong move in one direction after the report, and then wait for a pullback / reversal, until the oscillator to show you that there is a “better price” that you can use for an entry.
2. Look for divergence. You can look for hidden or regular divergrences, you can use the MACD, Stochastic, RSI, or any other indicator that you like.
3. Moving average crossovers. You might consider a crossover of a moving average as a sign that a post-NFP move is going to head in one direction or another.
4. Elliott Wave: One idea that I’ve been interested in is whether Elliott Wave theory can predict the length of a post-NFP move. I am definitely interested in exploring this option myself.
There are a zillion other indicators that you could use.
Conclusion
There was a time when I made the majority of my trades in the short term, and most of those trades occurred directly after an economic report was released. I took big risks and I made a lot of money. I also lost money and experienced a lot of stress. I had arguments with currency dealers about slippage, or about stops and limits. I was anxious on every first Friday.
I want to say this again: trading right after an economic report is released can be very dangerous to your account balance. I did it myself for a long time. I no longer do it at all.
I am not saying that it is IMPOSSIBLE to trade directly after a report is released. I am simply warning you that trading after an economic report carries enormous risks.
Trading for the longer term, and looking for the bigger moves, can be very rewarding, less stressful, easier to manage, and more profitable in the long term. I find that many traders that I work with move from short term trading to longer term trading so that they can get more out of each move and spend less time staring at charts. Trading in the longer term might not be best for you, but I believe that it is worth considering.
I look forward to hearing your thoughts and trading ideas with you. Keep in touch!
About the author
Rob Booker trades for a living. There is no better way to make a living. I am a currency nerd. This is what I love. I also train others to trade for a living. I have worked with traders on nearly every continent, in nearly every country that we learn about in school.
|
