|
TWO DAY CANDLESTICKS COMBINATIONS
Two consecutive candlesticks with the same body color show trend continuation.
Two consecutive candlesticks with different body color give us some signals.
I. BULLISH SIGNALS
1) PIERCING CANDLESTICK (kirikomi)
It consists of a white candlestick that opens the second day lower than the previous low of a long black candlestick and closes at or above the 50 percent of the previous day range of the candlestick. This formation gives us a strong bullish signal.

Figure4. A piercing candlestick
2) UPSIDE GAP CANDLESTICK (TASUKI)
This pattern occurs in strong up trends. It is a second day black candlestick that closes an overnight gap opened on the previous day by a white candlestick.
Gaps are not often in Forex market but when they occur mean a strong trend in the direction they happened. Market will always close them but not always the following days of the gap. When this candlestick appears it means that the gap was closed the day after it happened and market should continue its uptrend. This pattern is rare at Forex markets.
3) BULLISH ENGULFING CANDLESTICK
It is a strong bullish signal. It consists of a second day long white candlestick whose body surrounds the previous day’s black body.

Figure5. A bullish engulfing candlestick
II. BEARISH SIGNALS
1) DARK CLOUD COVER
The most bearish candlestick signal is the dark cloud cover (kabuse). It is the opposite of kirikomi and consists of a second day black candlestick that opens above the previous day’s high and closes midway through the previous day’s white long body.
One could watch three types of dark cloud cover:
- Long black candlestick which closes under the 50% of the previous white candle shadow up
- Black candlestick closing exactly at 50% of the previous white candle
- Long black candlestick which closes under the 50% level of the original white candlestick shadow down
- We should have confirmed signals of other indicators such trendline resistance etc
Figure6. Schematics of dark cloud cover
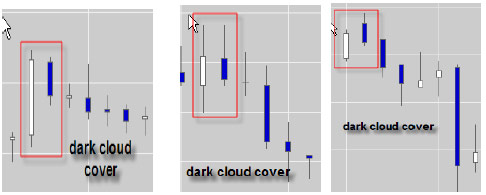
Figure7. Dark cloud cover candlesticks in real market environment
2) BEARISH TASUKI
It is a long white candlestick that has a low above 50% of the previous day’s long black body and closes marginally above the previous day’s high. It is assumed that second day’s rally in only temporally and driven by profit taking. Downward trend is likely to continue next day.
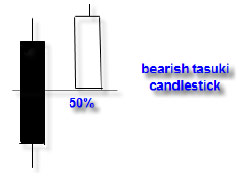
Figure8. Bearish tasuki candlestick
III. WAIT AND SEE CANDLESTICKS
1) HARAMI
It is the opposite of the engulfing candlestick pattern. Second day’s candlestick occurs within the previous day’s body. Two consecutive candlesticks may have opposite directions but it doesn’t matter which is first. Market is ambiguous until further information become available.
EXTRA CAUTION: when the engulfed candlestick is a Doji then the harami pattern becomes a reversal signal. Direction should be the opposite of first day’s direction.
2) HOSHI CANDLESTICK (STAR PATTERN)
Identical to the harami candlestick. It consists of a tiny body appearing the following day outside the previous day’s body. It is not important if the star reaches previous day’s shadows as soon as it is outside the body. The direction of the consecutive candlestick is also irrelevant. Signal is wait and see.

Figure9. Star pattern candlestick
3) KENUKI (TWEEZERS) CANDLESTICK
Here the two consecutive candlesticks have the same high or the same lows. In an upward trending market tweezers top occurs when highs are the same. The opposite happened in a tweezers bottom. EXTRA CAUTION: Wait and see interpretation changes to reversal when the pattern occurs after an extended move.
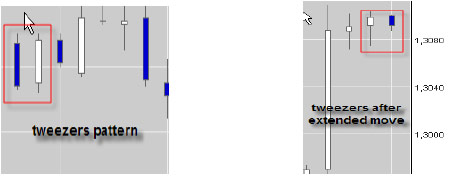
Figure10. Shows tweezers candlestick in real market
|
