|
In this tutorial you will learn how to correctly evaluate trends using forex candlestick charts. Always remember: candlesticks should be used in longer term time periods, preferably daily, in order to be more valid about the trend signals.
Candlesticks consist of the body and the shadows. Body gives information of the direction of the market. White body indicates that the price of the currency pair closed higher than it opened and black body the opposite. Shadows show the high and low of the price for the given period.
REVERSAL CANDLESTICKS
We will refer to the most common of candlesticks which you should use in order to identify trends.
1) DOJI
When the opening and closing price are identical we have a Doji candlestick. These candlesticks have no body (or almost no body) at all. They may mean the end of a trend. Market reverses but may not reverse immediately due to pressures to the opposite side that after a while lose their steam.
In order for Doji To have reversal significance:
- Doji should be drawn on daily chart
- It must occur on relative low or high of the market
- If it occurs in the midway of a trend the signal is neutral(rickshaw man candlestick)
- We should have confirmed signals of other indicators such trendline resistance etc
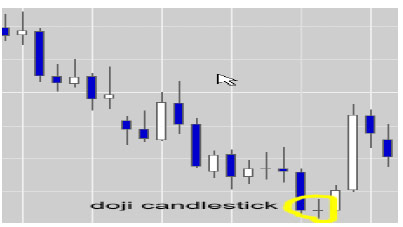
Figure1. A Doji candlestick signaling reversal
2) HANGMAN
The signal is “sell at top”. It is called hangman because traders that haven’t seen it will be hanged that is caught to the violent reversal of the market. Signal is sell at top.
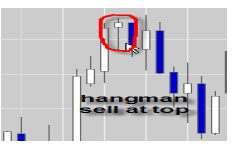
Figure2. A hangman candlestick
3) HAMMER
Same as hangman, but with black body. Occurs at the bottom of the trend and “hammers” all the traders that missed the market reversal. Signal is buy at the bottom.
EXTRA CAUTION: The same as dojis apply but you should also remember that the body of the candlestick is relatively small. (not bigger than one half or one third of the shadow).
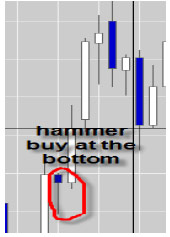
Figure3. A hammer candlestick
Let’s now look some combinations of candlesticks that give us extra signals.
|
