|
TRENDLINE CHART FORMATIONS
There are chart formations indicating the reversal or continuation of a trend. These patterns occur in any time frame although the higher the time frame the more significant they are. We shall study at first trend reversal patterns. This means than when you recognize these patterns in a chart there is a high probability that the current trend will reverse.
HEAD AND SHOULDERS
Name of this formation is given after its shape. This formation looks like a head and shoulders. It consists of three consecutive rallies all based in the same support line named neckline. The two shoulders should be almost equal on height and head should be the highest. You may enter the market during retest of broken neckline. The most significant head and shoulders pattern is in weekly or monthly or daily charts. Head and shoulders on lower time frame are unreliable. Price target is the length between top of head and neckline.

Figure 8. Head and shoulders pattern in a daily chart.
In real market environment head and shoulders almost never appears as clean as the schematic. Trader must be careful not to misinterpret false head and a shoulder keeping in mind that neckline is seldom a perfect horizontal line although the significant point of the formation should be tangential to the neckline. The same applies to inverse head and shoulders

Figure 9. Inverse head and shoulder pattern.
Look at the above market examples carefully. Then check the schematic below. Practice a lot. In order to recognize head and shoulders in market environment your eye should be flexible enough.

Figure 10. Schematics of head and shoulders pattern
DOUBLE TOP AND DOUBLE BOTTOM
This formation consists of two consecutive peaks or troughs of approximately the same height. The more equal the height the more significant the formation. Resistance line is formed connecting the two tops.

Figure 11. Schematics of double bottom and double top
Consider these in order to validate the formation:
1) The higher the time frame the more valid the formation
2) Contact points should be tangential to the resistance line. In real market environment contact points cannot be perfectly tangential. Take this into account when deciding whether a formation is a valid double bottom or not.
3) You should only trade upon confirmed break and retest of resistance line. Breakout confirmation consists of a closing price outside the resistance line.
4) Target price is relevant to price and time symmetry and make take long to be fulfilled.

Figure 12. Double bottom in real market environment
TRIPLE TOP AND TRIPLE BOTTOM
The same apply to triple top and triple bottom formation. This formation is a hybrid of double top or bottom and head and shoulders.
TREND CONTINUATION PATTERNS
These patterns signal the continuation of the previous trend. Unlike trend reversal patterns they consist of short consolidation periods.
FLAG FORMATION
It looks like a flag. It consists of a steep upward or downward trend (flagpole) and a brief consolidation period which tends to be sloped in the opposite direction of the trend or it is simply flat. Consolidation is bordered by support and resistance lines which are parallel or mildly converging to each other. These lines give the flag.
When price breaks out of consolidation price target is the length of the flagpole measured from the point of breakout. The higher the time period of flag formation the more valid the signal. Beware of false breakouts from the flag.

Figure 13. A bearish flag

Figure 14. Another bearish flag
PENNANT FORMATION
Pennants are the same as flags with the difference that support and resistance lines of consolidation period converge much more than flags.

Figure 15. A bearish pennant
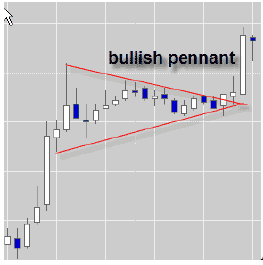
Figure 16. A bullish pennant
TRIANGLE FORMATION
Triangles are pennants with no poles.
There are four types of triangles:
1) Symmetrical: it consists of two symmetrically converging resistance and support lines with at least four significant points (eg. 2 on resistance and 2 on support). This pattern visualized the ambivalence of Forex market balance between supply and demand and breakout may occur on either side.
2) Ascending triangle: Flat resistance line and rising support line. The breakout should occur on the upside with price objective the width of the base of triangle measured above the breakout
3) Descending triangle: Flat support line descending resistance. Breakout should occur on the downside.
4) Expanding triangle. Support and resistance lines converging towards the beginning of the formation. Expanding triangles are rare in Forex Market.
In real market environment do not expect to find absolutely flat lines. Support and resistance lines should be designed according to hi/low of the prices. Take good care in designing these patterns.

Figure 17. A descending triangle
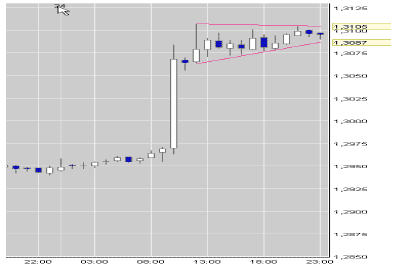
Figure 18. An ascending triangle

Figure 19. A symmetrical triangle
WEDGE FORMATIONS
It resembles the shape of triangles but it behaves like a pennant without a pole. It signals only continuation of the trend with no price objective. It is heavily sloped and breakout occurs to the opposite direction of the slope. There are two type of wedges: falling and rising.
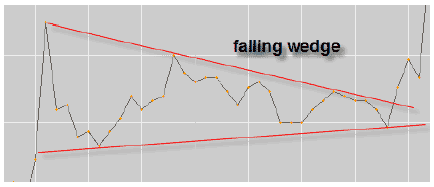
Figure 20. A falling wedge

Figure 21. A rising wedge
RECTANGLE FORMATION
This formation reflects a consolidation period. Breakouts may occur on either side and price objective is the height of the triangle.

ALWAYS REMEMBER
1) Always try to design these patterns in longer term time charts and on line charts. If you prefer to use candlesticks use the shadows as contact point for your resistance and support lines.
2) False breakouts are common so do not be trigger-happy with your trades until it becomes clearer. False breakouts tend to occur more often in the case of continuation patterns. Valid breakout on the other side shows the continuation pattern we thought we designed was a reversal pattern. Design your patterns carefully. |


