[an error occurred while processing this directive]
[an error occurred while processing this directive]
Harness The Power Of Forex Trend Lines: Part 2
Written by Louizos Alexander Louizos
|
SUPPORT AND RESISTANCE LEVELS
Market prices move in zig zag fashion. Peaks represent the price where more people sell than buy so market couldn't overcome this price. These prices are called resistance levels.
The troughs on the other hand represent the price where buying pressure was higher than selling. These troughs are called support levels.
Connecting consecutive peaks a trader has a resistance line and connecting resistance levels a trader has support line.
The first you have to learn is to draw support or resistance lines correctly and how to evaluate the significance of each line whether it is support or resistance.
When you realize that the market is upward trending you should draw a resistance line. To draw a resistance line pick up two peaks and draw the line connecting these peaks. See figure below. When a third contact point occurs then trendline is confirmed. Generally currency markets maintain its direction of trend.
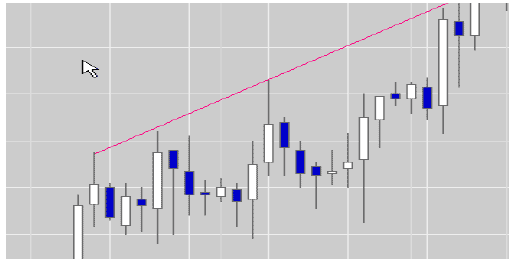
Figure 4. A resistance line in an uptrend
Follow these rules to see whether your trendline is significant:
1) At least two peaks are connected. More connecting peaks confirm the trend line.
2) Most significant trend lines occur around the angle of 45 degrees. Trendline at sharper angles are indicating that trend is strong. Lower level trendlines indicate that trend is close to reversal.
3) Longer period trendlines should be given increased weight. Day charts trendlines are more significant that 1 hour charts.
4) Minor trendline penetrations (as long as 1%) should and may be disregarded. When connecting two peaks never mind about a peak penetrating a bit the trendline.
5) When you draw a trendline in candlestick or bar charts and connect two peaks or troughs and there is an intermediate shadow over the trendline this is not considered a break as long as the closing price is below the trendline See figure 2.13
The same apply for connecting two troughs although the trendline is named support. Support lines are drown in downtrend markets

Figure 5. Support line is drown is a downtrend market
The most important thing about support and resistance lines is that when a confirmed support or resistance is broken then broken trend line is retested and support line becomes resistance and resistance becomes support. Notice below how the support line when broken became resistance.

Figure 6. Broken resistance line is broken then retested and became support
This way you already have the first prediction utility of market movement. Watch carefully market when it reaches significant support of resistance levels.
Test a lot with trend line support and resistance and channel designing (see below for channels). These are one of the most important tools you will ever use so it is very crucial to know how to use them correctly.
FOREX CHANNEL LINES
One of the most important elements of trendline resistance is channels.
Channels are two parallel lines that restrict price action. In order to draw a channel you should first draw a support or resistance line.
To draw a support or resistance line select an obvious trend and connect two hi or low points of price action. Then draw a parallel to the first line that restricts price movements.
That is the channel line. When price fails to reach support or resistance and is closer to channel line then we may see acceleration of the trend. When price fails to reach channel line then the ongoing trend may be weakening. Channel breakout means that the prices retest the broken channel line. After successfully retesting of channel lines we have a price target at least equal to the channel width.
Channel lines act as resistance and support. When broken they are usually retested. This test gives us a trade entry point. If channel lines are at the same level as a Fibonacci retracement level then price reversal is imminent because Fibonacci resistance gives extra support to price action (you may take a look at our Fibonacci trading chapter in this book now). Look at the figure 2.14. It is an 11-17-2006 EUR/USD chart

Figure 7. Channel lines in an uptrend with Fibonacci levels
Look how the broken channel line is retested and then price action reverses. Watch the price target or the broken channel line equal to the width of the channel. Also notice how the channel line with added Fibonacci 50% support line restricted price action. This trade setup may be used as a trading system. Feel free to use it and see profits come. This setup is one of the favourites for professional fund managers.
|
[an error occurred while processing this directive]
|
|
[an error occurred while processing this directive]
[an error occurred while processing this directive]


