|
A forex chart is a visualized representation of the price movements between buyers and sellers in the currency market and is a technical trader's primary tool to analyze the market in real-time. The more serious you are about trading, the more serious you need to be about charting. If you want to succeed as a forex technical trader, you simply need charts.
Where do I get charts?
Most forex brokers will offer free forex charts when you open a forex demo account or a live trading account. If you want to subscribe to a professional charting package service, always request a free trial first.
Features that should be included in your forex charting package :
What follows are six important features that should be included when you subscribe to a charting service:
| Real Time Quotes: |
Majors, commodity pairs and most popular currency crosses
( EUR/USD, USD/JPY, USD/CHF, GBP/USD, USD/CAD, AUD/USD NZD/USD, EUR/GBP, EUR/JPY and EUR/CHF). |
| Technical Indicators: |
DMI/ADX, Bollinger Bands, MACD, Moving Averages (Simple, Exponential, Weighted), RSI (Relative Strength Index) and Stochastic oscillator. |
| Type of Charts: |
Candlestick and bar charts. |
| Charting Tools: |
Trends, channels and fibonacci retracement. |
| Timeframe's: |
1 min, 5 min, 15 min, 1 hour, 4 hour, daily and weekly timeframe. |
| Miscellaneous: |
Zoom in-out, drawing tools, multiple charts on screen, save/load and customize your charts function. |
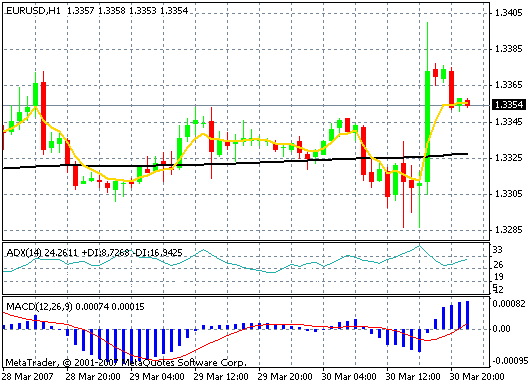
How does a forex chart look like?

EUR/USD 1 hour candlestick chart + ADX and MACD technical indicator(chart example) |

