|
If there is one thing that a trader would want to know for certain, it would be to catch the bottom or top of a trend. But simple as it sounds, it is easier said than done. Knowing that a certain price wave is completed, or is just a retracement in the larger trend, becomes more of an art than a science.
In such situations, using multiple sources of confirmation helps to avoid the potential false signals, and preserve our capital for only those situations that provide us with the most favorable risk to reward scenarios. Keeping that in mind, we will use two very different indicators – the ADX (Average Directional Movement Index) and the PSAR (Parabolic Stop & Reverse) - to form a system which should help us to trade as close to the top / bottom as possible.
First we shall look at both the indicators in detail, and find out their characteristics.
The ADX (Average Directional Movement Index)
The ADX is a trend-following system developed by Welles Wilder. Though it can be used as an independent indicator, it t is usually a part of the DMI indicator and determines the market trend.
Therefore, let us also briefly study the DMI indicator. This comprises of two lines – the Plus DI & the Minus DI lines.
The characteristics of the Directional Movement Indicator are: You establish a long position whenever the Plus DI crosses above the Minus DI. You establish a short position, when the Minus DI crosses above the Plus DI.
A simple DI+/DI- crossover is an entry and exit system. However, used that way it produces frequent whipsaws. Hence we combine this with the ADX to reduce these whipsaws.
The ADX thus forms an integral part of this system, as it gives a warning for a market about to change direction. It gives precise interpretations of the price action as follows –
- The ADX tells you if there is a trend present or not. It also informs you if it is early or late in a trend.
- It informs of a de-trending, of a reversal and renewal.
- The ADX however does not indicate the direction of the trend, only the strength of the trend.
Now in our chart here, we have the red line as the minus DI, the blue line as the plus DI, and the green line is the ADX. I have drawn a line at the 20 level for the ADX, since the rise of the ADX above 20 signifies an emerging of a trend.

Overall if we observe only both the DMI lines (the blue and the red) it does give a correct picture of the trend, and keeps us in the correct side of the market.
Simply put, at the area marked with the red line, the –DMI line is above the +DMI line, signifying a downtrend.
And at the area marked with the blue line, the +DMI line is above the –DMI line, signifying an uptrend.
But what about the areas, where the DMI lines have frequent crossings. This is the kind of situation which will whipsaw out any position and this where the ADX is used in tandem.
The indication for an entry into a trend is when the ADX starts rising from the lows. And ideally the ADX should be pointed up at all times when entry is being considered
But we are concerned right now with the end of the trend.
The turning points in markets are often heralded by turns in the DI+/DI- at upper and lower extremes shortly followed by a down turn in the ADX. This setup is near coincident with major turning points.
Thus the conditions for exit are -
- The DI+/DI- lines should show signs of declining momentum at their extreme levels, by turning down.
- These lines should cross the rising ADX line down.
- We look to exit the trade only when the ADX line starts to fall down.
- The subsequent crossover of the DI+/DI- lines would give us an additional confirmation of the change in trend.
In case of an existing uptrend, the DI+ line would signs of flattening and then cross the ADX line (which could still be rising). The confirmation of the change of trend to the downside would come only when the ADX starts declining. This would be followed by the DI+ line crossing the DI- line down.
Similarly in case of an existing downtrend, the DI- line would signs of flattening and then cross the ADX line (which could still be rising). The confirmation of the change of trend to the upside would come only when the ADX starts declining. This would be followed by the DI- line crossing the DI+ line down.
This use of the ADX for the exits is called the "turning-point" concept. The relationship of the three lines with the ADX being the highest tells us that there has been an extended price move which is running out of momentum. If we apply our rules to our example here –

- We will consider an entry only at this point marked ‘A’, when the ADX has started rising.
- We consider exiting the trade, only when the plus DMI has reached an extreme level, and the ADX is turning down at this point.
Even though this is a high probability setup, we can use an additional confirmation factor, since there is some lag in decline of the ADX line, and the subsequent crossover of the DI+/DI- lines.
A lot of times, the crossover and the decline of the ADX occur much after the price has moved a considerable distance in the direction of the changed trend, and hence some profits in the new direction may have been missed.
With the intention of reducing this lag, and the idea that there would be room for further improvement, it was found that the PSAR provided much more timely entry triggers.
PSAR (Parabolic SAR)
The Parabolic SAR (Stop And Reverse) was developed by J. Welles Wilder Jr. and is primarily used in trending markets. Wilder recommended establishing the trend first, and then trading with Parabolic SAR in the direction of the trend.
The Parabolic SAR allows the trader to follow the dots in an upward or downward trend, until the trend reverses. Thus it is also called a reversal system, and is more popular for setting stops than for establishing direction or trend.
Interpretation -
- If the trend is up, buy when the SAR moves below the price. This will be the stop level below the current price, which will move up every day until activated (when price falls to the stop level).
- If the trend is down, sell when the SAR moves above the price. This will be the stop level above the current price, which will move down every day until activated (when price rises to the stop level).
The concept is that as the price rises, the dots will rise as well, first slowly and then picking up speed and accelerating with the trend. The SAR starts to move a little faster as the trend develops and the dots soon catch up to the price action. This is what we call as activating the stop level, and is taken as a signal to exit the long position.
Drawbacks –
- Although it works extremely well in markets with a dominant trend, it fails miserably in horizontal or choppy markets.
- If and when prices do not develop consistent trends, it creates a jerky SAR which makes it difficult to enter and exit.
Let us take the following example to get a better idea of the characteristics –
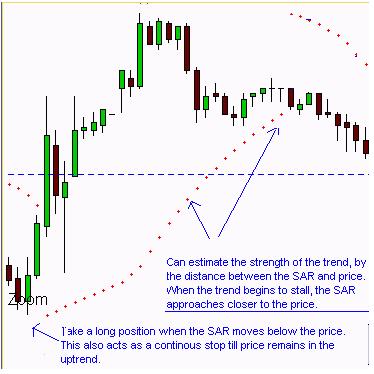
Let us examine the different situations of the SAR as described above.
We look at the initial long position, which we have marked on the chart. We can see that the SAR flips below the price, when the uptrend starts.

Similarly for the downtrend, we notice how it flips above the price, and can be taken as a stop level.
Combining the two indicators to form an effective technique.
In this case, we use the particular characteristics of the PSAR, that it works extremely well in markets with a dominant trend and that it accelerates steadily as the prices trend. The stronger the trend the closer the Parabolic gets to the prices, which is exactly what we are looking for.
So when the parabolic indicator is close to the prices and we have our ADX "turning-point" setup formed, we have all the ingredients for an excellent trade. Even a very small countertrend move will now quickly cross the Parabolic and signal an aggressive entry.
These entries will usually occur before the ADX starts declining. Hence this becomes a very reliable pattern that is designed to identify a major reversal in direction. Another advantage of using the PSAR is that we can use it to define our exits. We should exit our trade when the PSAR flips to the opposite side.
One can apply different money management principles for the exit of a trade, but the basic concept to remember is that a change is indicated when the PSAR flips to the other side of price.
Sunil Mangwani is a Physics major with a Diploma in Finance Management. He started his career in the construction business, and worked for about 15 years executing civil projects in the defence and industrial fields. Around the year 2000, Sunil discovered the exciting world of forex trading and knew that he had found his métier.
Sunil is now the Director of Education at FX Instructor, LLC. http://www.fxinstructor.com |

