|
Introduction
Traders indulge into various kinds of trading: positional trading, intraday-day trading, scalping, swing trading, etc. Where positional trading is of longer duration, the rest of them are of shorter duration ranging from a day to just a couple of minutes to take the required profits. In order to get the optimum gains, they depend on various technical tools which help them in forecasting movements on the basis of a given price chart. One of the many possibilities here is to benefit from a Fibonacci Grid as a swing trader.
Swing trading is a type of trading wherein investors look for quick gains. It is very similar to day trading, where investors don't hold their positions over night. Given the opportunities provided by market movements, swing traders enter and exit the market in the same day or even within a couple of hours. Hence, in order to capitalize on short-term market moves investors need indicators which help gain the required return as quickly as possible. The Fibonacci Grid is one of those indicators which help benefit from price swings.
Technical analysis in general works on the basic assumption that history repeats itself. By using a Fibonacci Grid, we assume that currency quotes are bound to retrace back to their previous levels from the present value and then bounce again.
The Fibonacci Grid is a mathematical calculation showing the retracement levels based on the Fibonacci ratios of 0%, 23.6%, 38.2%, 50%, 61.8%, and 100%. Fibonacci retracements are horizontal lines which indicate supports or resistances of the current trend. They are calculated by first locating turning points of the given chart: One needs to find the highest level and the lowest level of the quote during the specified time period. Then a line is drawn from any of the two points, the high or the low, and towards the other point. Six lines are drawn at different Fibonacci levels: 100% indicates the start of the move while 0% indicates the reversing point. 23.6%, 38.2%, 50% and 61.8% indicate the various support/resistance levels.
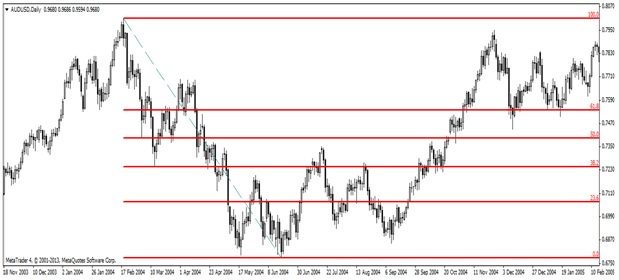
In the above example of AUDUSD daily chart, 0.8009 is the start of the downfall with the 100% mark, while 0.6778 works as an end to selling pressure with the 0% mark. As we can see, the Fibonacci grid indicates 4 levels between 0.8009 and 0.6778, which can be used as support and resistance levels. Noticeably all of them have worked out to be important support and resistance levels.
Strategy:
A Fibonacci grid provides important support and resistance levels which could be of great importance to swing traders as they look for quick benefits resulting out of currency quote swings. A trader first needs to look at the reversals, i.e. if the prices have fallen previously, they should wait for the prices to bounce back from the low and vice versa. A trader should take buy positions if the currency is moving upwards and breaks the resistance level. The other way round, an investor should take sell positions while a currency is moving downwards and breaks the support level. The target should be the next resistance/support level while the stop/loss should be the previous support/resistance level.

AUDUSD daily chart: As it can be observed from above chart, the majority of the reversals from the 0.9685 level can be termed as swings. The quote (AUDUSD) used to first fall below the support line and then bounce back, breaking the next resistance line. Hence, a swing trader should take a buy position when the quote takes a bounces back from the support line with the target of the resistance line and a stop/loss set at the previous support line. In our example, on May 21st, AUDUSD broke the support of 1.0063, but the pair reversed on May 25th, and once again breaking the resistance line of 1.0063, the pair directly touched 1.0257 on May 29th. Hence, a trader who had bought near 1.0050 on May 26th with the stop loss of 0.9880 could have achieved the target merely in four days.
USDCAD four hour chart: Swing traders can benefit from Fibonacci retracements not only on the daily chart, but also on the four hour chart.

As becomes clear, the pair rallied from 0.9979 to 1.0372 and subsequently touched the 0.9980 level. A swing trader could have taken profit from the above depicted move by taking a sell position when the quote started falling from 1.0372. Sometimes the volatility makes it difficult for a trader to enter at the exact turning point. Still, investors can take positions subsequently if the pair is still signaling the same movement.
For example, on October 27th, 2012, the price took a swing from the 1.0340 level. A swing trader could have taken a sell position below 1.0285 (say 1.0266, to be more pessimistic) when the pair sustained the selling pressure and broke the 23.6% retracement level. The stop/loss should have been 1.0285, while the target should have been 1.0224. We can witness that with the stop/loss of just 19 pips, the trader could make a a target of 42 pips in a single day.
Feedback:
Even though Fibonacci retracements help traders to identify various supports and resistances, they are just a mathematical calculation. It is not necessary that each and every time a pair observes this indicator; there are times when a pair breaks a particular retracement level and then bounces back. It also happens that a particular pair keeps on moving between specific zones, which can be of no use for swing trader.
In times of high volatility, market might move quickly for a trader to react and one can not take the advantage of Fibonacci levels.
Hence, it is advisable to use this indicator in conjunction with other technical tools for the sake of perfection in trading.
Source: www.forexball.com, A leading Forex trading Competition.
|
