|
If there is one thing in the whole technical analysis panoply of tools, we would choose the Fibonacci retracement percentages ladder. It is not the place to enter into the theory behind these numbers but it is always amazing how well their use will help the trader-investor in his efforts to understand the markets gyrations.
There are many applications in which we can apply one variant or another of the Fibonacci numbers and their relationships, but our preferred one is this power of theirs to predict levels of retracements in a corrective phase.
In the classic technical analysis methodology, a correction should be between a third and two third of the previous move. Less than that, it would be viewed as a part of the trending move and not a correction. More than that would be considered a "deep correction" with a tendency to treat it as the first sign of weakness in the prevailing trend. The Fibonacci counterpart of one third is the 38.2% area and the one for two third is the 61.8% area.
Furthermore, the 50% retracement is considered the most common in the financial world of assets. Half is a nice point of reference and it seems at times that it is a prophecy that is fulfilling itself. So many traders look for this area for a re-action in the price, that many of them will come and buy or sell in this exact point. By doing so, they are creating the effect that they are waiting for.
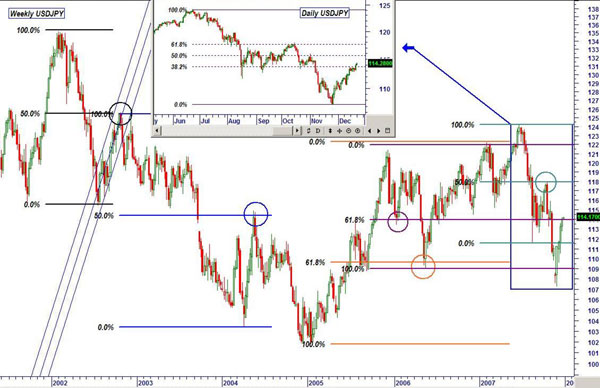
Our visual aid is the weekly chart of the USDJPY with a daily chart insert. Look how many price moves have been retraced by EXACTLY 50% (back, blue, light green) and EXACTLY 61.8% (violet, orange). You can also find many more in the daily and intraday time frames.
How can we use this feature effectively? First, the trader should understand that the price and only the price is giving signals to go long or short. Any other indicator or tool is only helping. Some a bit more than others and we consider this one a great help. So, the thing to do is "to be ready" when the price arrives near the Fibonacci percentages.
If the correction suddenly stops and reverse, it is a good sign that the old trend is returning and to enter a position in its direction. Such a position should be protected by a very tight stop-loss over or under the Fibonacci level that was the limit of the reversal. For example: in the black correction (end of 2002) the trader would be prepared from 124-5. When the price did break the ascending channel, the trader should have taken a short with a SL at 125.75.
What about now?
The daily insert shows that the current correction up did not yet reach the 50% Fibonacci retracement. In view of the history in this pair, it is safe to say that there is a way to go to the upside for the USDJPY. We should be ready near 115-116 and then near 118 for the end of this move. If the JPY will go further, we should consider that a change in the main trend is in the cards.
Disclaimer
By no means do any part of this article recommends, advocates or urges the buying, selling or holding of any financial instrument whatsoever. Trading and Investing involves high levels of risk. The author and his company express personal opinions and will not assume any responsibility whatsoever for the actions of the reader. The author may or may not have positions in Financial Instruments discussed in this article. Future results can be dramatically different from the opinions expressed herein. Past performance does not guarantee future results. The content of this article was created with the best known data at the time. The writer and his company are not responsible for the accuracy or completeness of the mentioned data. The writer is not a registered consultant of any kind and so the reader should not see any single part or the whole analysis as an advice for any kind of action in the financial markets.
About the Author
 |
Moshe Shalom
Head of Technical Analysis Department
ForexManage Ltd
|
|
