The Relative Strength Index or RSI was developed by J. Welles Wilder in 1978. It has since become an extremely useful and popular momentum oscillator. The RSI compares the magnitude of a market's recent gains to the magnitude of its recent losses and turns that information into a number that ranges from 0 to 100. A reading of 70 or higher is considered overbought with an increasing chance of a reversal to the downside, while a reading of 30 or below is considered oversold with an increasing chance of a reversal to the upside.
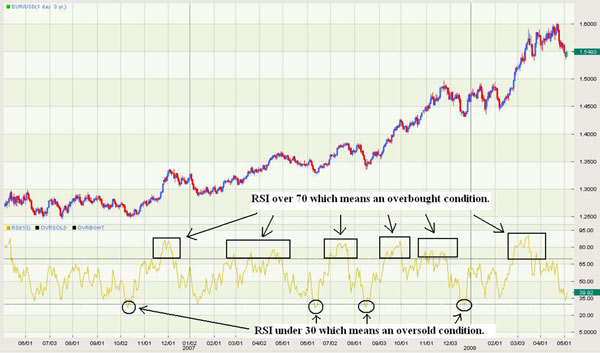
But not all of the time and that is what can get new traders into trouble. Like any technical indicator, they are really designed to help you time your entry, but without a clear idea of what a trading opportunity looks like, too often new traders just use the extreme moves by the RSI to above 70 or below 30 to automatically signal their trade. The chart below shows how the moves below 30 resulted in reversals and good buying opportunities.
However, there were more moves above 70 which did not offer as many potentially profitable trades even though there were more occurrences. The difference is the direction of the trend. We always teach new traders to first identify the direction of the trend on the daily chart and then to only take trades in that direction.
I used this activity of the EUR/USD as an example of a strong uptrend where we should only be looking for buys. In a strong uptrend, the market will move up to overbought and stay there for long periods of time. That is what makes it an uptrend. But in that uptrend, we should look for pullbacks off of the highs down to support as potential buying opportunities. This is where the use of the RSI as it moves to below 30 and then up through 30 helps with our entry. We first need to identify the trend, find the potential trade, and then use the indicator to time our entry. On their own, technical indicators give off far too many false signals, but when used correctly, they can be a valuable addition to any trader’s approach.