Forex - Forex Trading - Currency Trading
  • Forex Brokers
    • Compare Forex Brokers
    • ECN/STP Forex Brokers
    • STP Forex Brokers
    • DMA/STP Forex Brokers
    • PAMM Forex Brokers
    • Metatrader 4 Forex Brokers
    • Metatrader 4 ECN Forex Brokers
    • Metatrader 5 Forex Brokers
    • Brokers With Free Forex Signals
    • Social Trading Forex Brokers
    • Bitcoin Brokers
    • Binary Options Brokers
    • NFA / CFTC US Forex Brokers
    • FSA UK Forex Brokers
    • Micro & Mini Forex Brokers
    • Forex Brokers For Scalping
    • Forex Brokers For Hedging
    • High Leverage Forex Brokers
    • Brokers With FX Managed Accounts
    • Forex Brokers With Free VPS
    • Gold,Silver & Oil Forex Brokers
    • Forex Brokers With Segregated Accounts
    • Brokers With Forex Demo Accounts
    • Best Forex Broker Bonuses
    • Forex Broker News
  •  
  • University
    • Online Forex Trading Course
    • Complete Forex Video Course
    • Forex Trading Tutorials
    • Learn How To Trade Currency Pairs
    • Candlestick Video Course
    • Forex Technical Indicators
    • Forex Chart Patterns
    • Forex Trading Tips
    • Metatrader 4 Tutorials
    • Metatrader 5 Tutorials
    • Free Trading Courses
    • Forex eBooks Collection
    • Forex Freebies
    • Forex Dictionary 
    • Forex Downloads
  •  
  • Trading Strategies & Systems
    • Simple Trading Strategies
    • Forex Breakout Trading Strategies
    • Price Action Forex Strategies
    • Elliott Wave Forex Strategies
    • Fibonacci Strategies
    • Fundamental Strategies
    • Trend Following Metatrader 4 Systems
    • Forex Scalping Metatrader 4 Systems
  •  
  • Articles
    • Technical Analysis
    • Forex Systems & Strategies
    • General Forex Knowledge
    • Forex Money Management
    • Trading Psychology
    • General Trading
    • Forex Trader Interviews
  • Tutorials
    • Trading Tutorials
    • Metatrader 4 Tutorials
  •  
  • MT4/5 Downloads
    • Metatrader 4 Indicators
    • Metatrader 5 Indicators
    • Metatrader 4 Expert Advisors
    • Metatrader 4 Systems
  •  
  • Products
    • FREE Forex Analyzer PRO
    • eToro Social Trading
    • Automated Forex Trading (ZuluTrade)
  •  
  • Charts
    • Real-Time Forex Charts
    • Real-Time Forex Rates
    • EUR/USD Forex Charts
    • GBP/USD Forex Charts
    • USD/CHF Forex Charts
    • USD/JPY Forex Charts
    • USD/CAD Forex Charts
    • AUD/USD Forex Charts
    • NZD/USD Forex Charts
    • EUR/JPY Forex Charts
    • GBP/JPY Forex Charts
    • EUR/GBP Forex Charts
    • EUR/AUD Forex Charts
    • EUR/CAD Forex Charts
    • AUD/JPY Forex Charts
    • CHF/JPY Forex Charts
    • EUR/CHF Forex Charts
    • GBP/CHF Forex Charts
    • USD/SEK Forex Charts
    • Gold (XAU/USD) Charts
    • WTI Crude Oil Charts
    • Silver (XAG/USD) Charts
  •  
  • Tools
    • Correlation Charts
    • Relative Strength Index
    • FX Performance Charts
    • Economic Calendar
    • Pivot Point Calculator
    • Forex Historical Data
    • Currency Converter
    • PIP Income Calculator
    • PIP Value Calculator
    • Risk Calculator
    • Fibonacci Calculator
    • Forex Income Calculator
    • Forex Risk Calculator
    • Banks Interest Rates
    • Movers and Shakers
    • Find A Forex Job
    • Forex Daily High/Low
    • World Clocks
  •  
  • $30 FREE
  •  
Bookmark and Share Print This Page   | Home > Complete Forex Trading Video Course

Forex, Futures and Stock Price Charts

Written by Informedtrades.com


Module 10: Forex Technical Analysis Basics
Lesson 4: Forex, Futures and Stock Price Charts
Back to complete forex trading video course.


Previous Lesson Next Lesson

Forex Video Text Version

In our last lesson we wrapped up our discussion on Dow Theory. Today we are going to talk about the basics of charts.

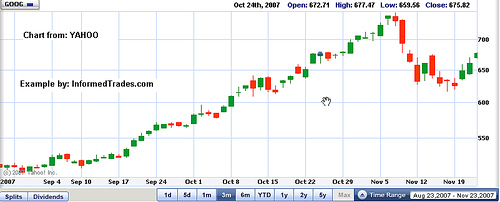
The tool of the technician when analyzing the forex, futures, or stock markets is the price chart. Very simply a price chart is a chart showing the movement of the price of a financial instrument over a chosen time. As you can see on the chart below of GOOGLE the bottom or x axis shows the time period which was chosen to display (in this case daily), and the vertical or y axis shows the price of the instrument (in this case the stock price of GOOGLE)

Chart of GOOGLE


Most charts will allow a wide variety of time frames to be displayed and the time frame that technicians choose to use varies widely and depends on each traders trading style. In general, longer term traders will focus on daily time frames and above, and shorter term traders will focus on intraday charts such as hourly or 15 minute charts. Many traders will also use a combination of time frames in order to get a full picture of what price has been doing by, for instance, looking first at a longer term daily chart, then moving to an hourly chart, and then finally to a 15 minute chart.

Types of Charts

Although there are many different types of charts which stock, traders of the stock, futures and forex markets use, the most common, which we will review below, are the line chart, the bar chart, and the candle stick chart.

Line Charts

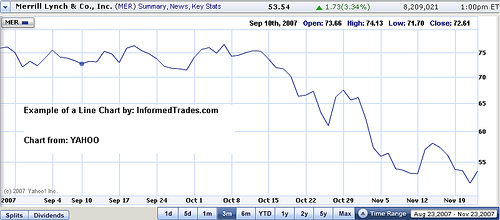
A line chart is the most basic type of chart as it displays the least amount of data. Very simply, line charts display only the closing price of an instrument and are used by traders who do not care about viewing the open, high, and low prices or when only the close price is available.

Example of a Line Chart:


Bar Charts

In addition to the close price, bar charts also show the open, high, and low prices for the time period selected. The name of the chart comes from the fact that the high and low of the instrument for the time period selected is displayed as a two points connected by a vertical line or bar. The open and close are then displayed as short horizontal lines placed across the vertical lines.

As you can see from the chart below bar charts display a much more detailed picture of the price movement of a particular security than do line charts.

Example of a Bar Chart


Candlestick Charts

Candlestick charts (which are also sometimes referred to as Japanese candlesticks because they originated in Japan) display the most detail for the price movement of a security of the three chart types listed here. A candlestick chart is similar to a bar chart with one significant difference – in addition to displaying the open, high, low and close prices, candlestick charts use different colors to represent when the open is higher than the close and vice versa.

In general when the open price for the time period selected is lower than the close, white or unshaded candle form and when the open is higher than the close a black or shaded candle forms. I say in general here in reference to the colors of the candles as sometimes instead of shaded and un shaded different colors such as red for down days and green for up days are used.

On a candlestick chart the thick or colored part of the data points is referred to as the body of the candle and the thin lines at the top and bottom (which represent the space between the open/close and the high/low for the time period selected are referred to as the wick.

Example of a Candlestick Chart and Candles:


Source: tradetrek.com


You should now have a good understanding of price charts and the main types of charts available to you as a trader. In future lessons we will go into more detail of how to utilize a chart to analyze and place trades. In our next lesson we are going to go over the basics of support and resistance and how we can use these levels to spot potential trading opportunities.


INTERESTING FOREX SITES
Free Forex Strategies & Systems
A collection of forex systems, indicators and strategies. 100% Free Download.
Download Free Top Rated Metatrader 4/5 Indicators & Forex Robots
Download top rated MT4/MT5 forex indicators and expert advisors.
100 Forex Trading Strategies
Each forex strategy includes the buy and sell rules, and a free download link!
Get Forex Analyzer PRO Forex System
Start trading with one of the best fx systems for profitable forex trading!

Back to complete forex video course

Find Us On Facebook

Best Forex Trading Software

Holo Eagle Forex System

Morpheus Forex trading System

Fibonacci Forex Scalper System


Home | Forex Newsletter | Site Map | Resourses | Forex Advertising | Forex Brokers | Forex Solo Ads | Contact Us
Any articles, systems, strategies, reviews, ratings, news, research, analyses, prices or other information contained on this website, by Aboutcurrency.com, its partners or contributors, is provided as general market commentary and does not constitute investment advice. Aboutcurrency.com will not accept liability for any loss or damage, including without limitation to, any loss of profit, which may arise directly or indirectly from use of or reliance on such information.


Copyright © 2021 Aboutcurrency.com. All rights reserved.
By using this site, you agree to the Terms of Use and Privacy Policy .
Risk Disclosure: Trading forex on margin carries a high level of risk, and may not be suitable for all investors. The high degree of leverage can work against you as well as for you. Before deciding to invest in foreign exchange you should carefully consider your investment objectives, level of experience, and risk appetite. The possibility exists that you could sustain a loss of some or all of your initial investment and therefore you should not invest money that you cannot afford to lose. You should be aware of all the risks associated with foreign exchange trading, and seek advice from an independent financial advisor if you have any doubts.