|
Fibonacci numbers were developed by Leonardo Fibonacci, a mathematician who was born in Pisa, Italy around 1172 and are a series of numbers in which each successive number is the sum of the two previous numbers: 1, 1, 2, 3, 5, 8, 13, 21, 34, 55, 89, 144, etc.

Leonardo Fibonnacci |
Using Fibonacci in forex trading
The most popular and most successful form of Fibonacci trading is based on retracements and can be useful for identifying support levels, resistance levels, and market reversals and placing stop losses.
Currency pairs will often retrace a percentage of the previous up-or-down move before reversing or continuing the previous trend, as prices retrace, support and resistance levels often occur at or near the Fibonacci Retracement levels.
The three most important and most popular Fibonacci retracement levels occur at – 38.2%, 50% and 61.8%. Your forex charting program will calculate and plot these levels automatically for you on screen when drawing the Fibonacci line connecting two extreme points. (top and bottom).
How to find market entry points using Fibonacci retracements?
In up trending markets:
As a general rule, when a currency pair price retraces to the 38.2% level from it's top and bounce again, then most likely, the previous up trend should continue. When price retraces to the 61.8% level, this can indicate the beginning of a trend reversal.
In down trending markets:
As a general rule, when a currency pair price retraces to the 38.2% level from it's bottom and fall again, then most likely, the previous down trend should continue. When price retraces to the 61.8% level, this can indicate the beginning of a trend reversal.
Lets' take an example for better understanding:
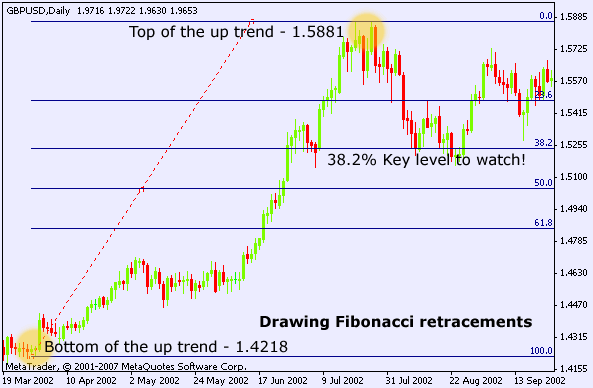
During March 2002-July 2002, the GBP/USD made a significant move up from 1.4218 to 1.5881 which equals 1663 pips! After it's significant move up, the GBP/USD was starting to retrace from it's top.
How far would it probably pull back before resuming its initial up-trend?
Draw the Fibonacci retracement line between the bottom and top and you will get a much better idea what can happen.
Looking to the chart above, the 38.2% retracement level is at 1.5246; or 1663 pips x 0.38.2 = 635 pips. 1.5881 - 635 = 1.5246
Remember: Your charting program will make the calculations and plot the retracement levels on your charts
According Fibonacci:
You can expect a bounce from there as it is expected the up trend will resume after reaching the 38.2% key retracement level.
In case the GBP/USD pair keeps falling below the 50% retracement level, then, the prior up trend is over.
As a general rule, when trading the 38.2% retracement level, you should place your stop at or below the 50% retracement level.
Using candlestick patterns to confirm Fibonacci retracement trades:
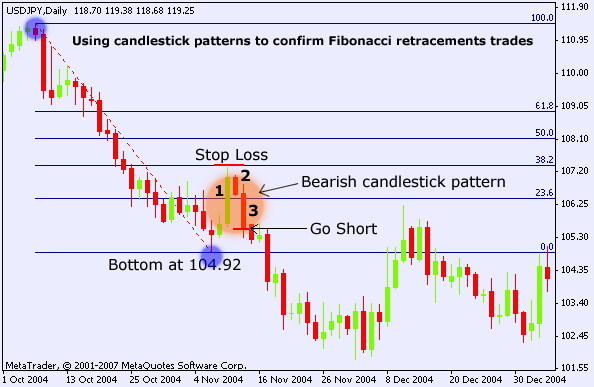
Looking to the above chart, the USD/JPY retraces to the 38.2% level from it's bottom and fall again (104.92 - 111.52).
A forex trader could take a possible short position at the close of candlestick 3 with stop loss 1 pip above candlestick 1, this trade was confirmed by a bearish candlestick pattern
Summary
- Find an ongoing up or down trend. Mark the top and the bottom of the trend and draw the Fibonacci retracement line.
- The default Fibonacci retacement levels are 38.2%, 50% and 62.8%.
- Fibonacci retacements are a very popular tool among currency traders and can help identify strategic places to enter or close trades.
- Fibonacci retacements works better on bigger timeframe's such as 1 hour, 4 hour and daily charts.
- Use Fibonacci retracements along with other technical analysis tools such as candlestick patterns to increase your probability of success.
|
