George C. Lane |
Developed by George C. Lane, " The Stochastics Man" in the 1950s.
The Stochastic Oscillator tracks market momentum and consists of two oscillator lines, called %D and %K.
Popular types of Stochastic Oscillators are: Fast Stoch and Slow Stoch.
Formulas
Two lines are calculated, called %K and %D.
%K compares the latest closing price to the recent trading range, ranging from 0 when the latest close is a new N-day low, up to 100 for a new N-day high;
n = number of periods

%D is a 3-day simple moving average of %K

Overbought / Oversold levels
Oscillator readings below 20% are considered oversold.
Oscillator readings above 80% are considered overbought.
Popular trading signals from Stochastic Oscillator
-
Buy when the Stoch Oscillator (either %K or %D or %K and %D) falls below the oversold level (e.g., 20) and then rises back above that level.
Sell when the Stoch Oscillator rises above the overbought level (e.g., 80) and then falls back below that level.
-
Look for positive and negative divergences between the Stoch Oscillator and the underlying currency price to predict market reversals.
Trending Versus Ranging Market Signals
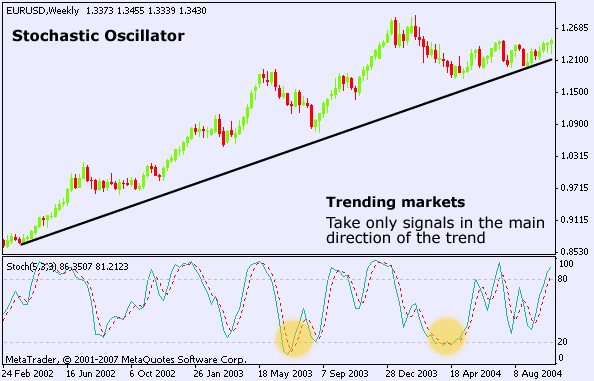
In trending markets, take only signals in the main direction of the trend. For an up-trending market, only look for oversold conditions, similarly, for a down- trending market, only look for overbought conditions.
I. In trending markets
- In an up trending market, go LONG if %K or %D falls below the oversold level and then start rising again;
- In a down trending market, go SHORT if %K or %D rises above the overbought level and then start falling again.

II. In ranging markets
- Go LONG when %K and %D falls below the oversold level and then start rising back above;
- Go SHORT when %K and %D rises above the overbought level and then start falling back below.

Positive and Negative Divergences between price and Stochastic Oscillator
One of the most reliable signals to use the Stochastic Oscillator is to wait for a positive or negative divergence to develop from overbought(80%) or oversold levels(20%).

Sell Signal (see above example)
Once the Stoch Oscillator reaches overbought levels, for a SELL signal, simply wait for a negative divergence to develop and then; a cross below the 80% overbought level confirms the negative divergence, a SELL signal is now generated.
Buy Signal
Once the Stoch Oscillator reaches oversold levels, for a BUY signal, wait for a positive divergence to develop after the Stoch indicator moves below 20% oversold level; after a positive divergence forms, a break above 20% confirms the divergence and a BUY signal is generated.
Note: It is recommended to use the Stochastic Oscillator in conjunction with other technical analysis tools to make a complete forex trading system. |


